GIS Analytics, Mapping & Reporting Services
GIS services help organise and interpret spatial data, turning survey and site information into clear maps, dashboards, and reports.
This allows project teams to better understand site conditions, identify patterns, and make informed decisions across planning, design, and environmental projects.
What is GIS Analytics and Mapping
GIS combines spatial data with analysis and visualisation tools to present information in a structured and accessible way.
By linking location-based data with project requirements, GIS helps translate complex datasets into outputs that can be used for planning, coordination, and reporting.
GIS supports a wide range of applications across different industries and project types, including:
Create zoning maps and spatial plans to support smart city design, growth management, and policy development.
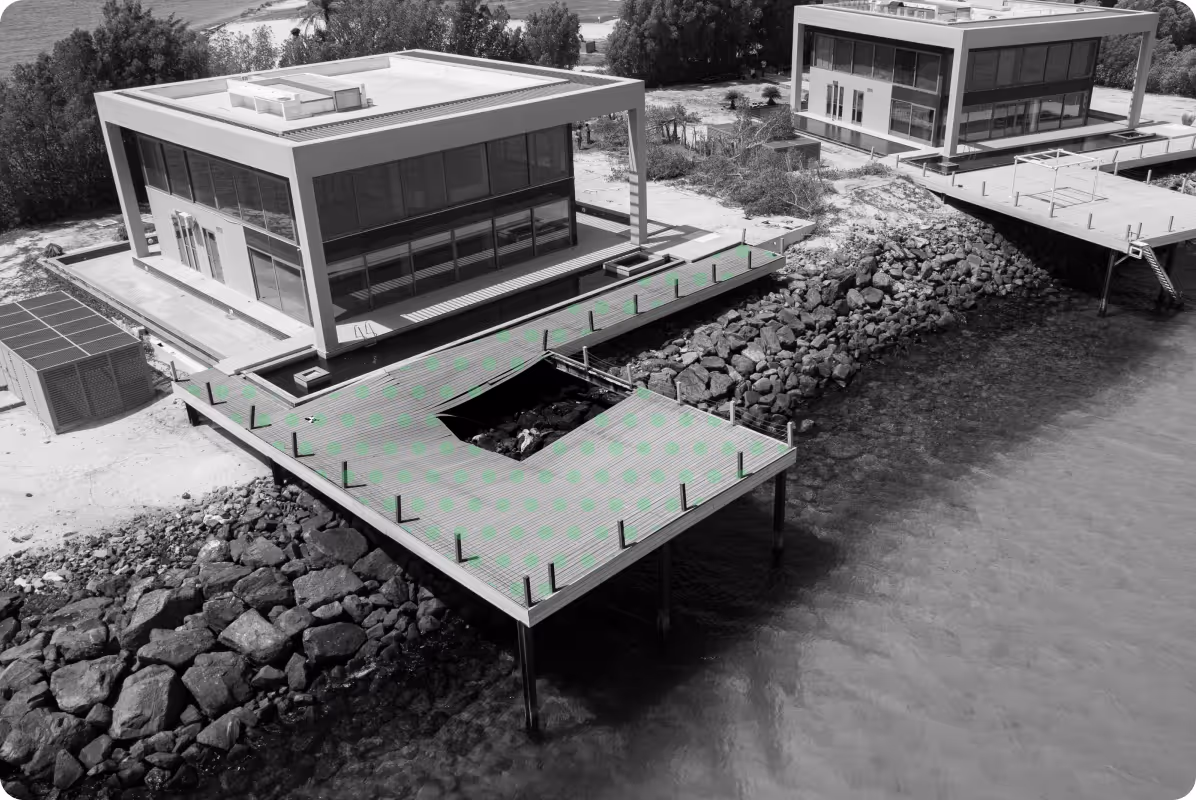
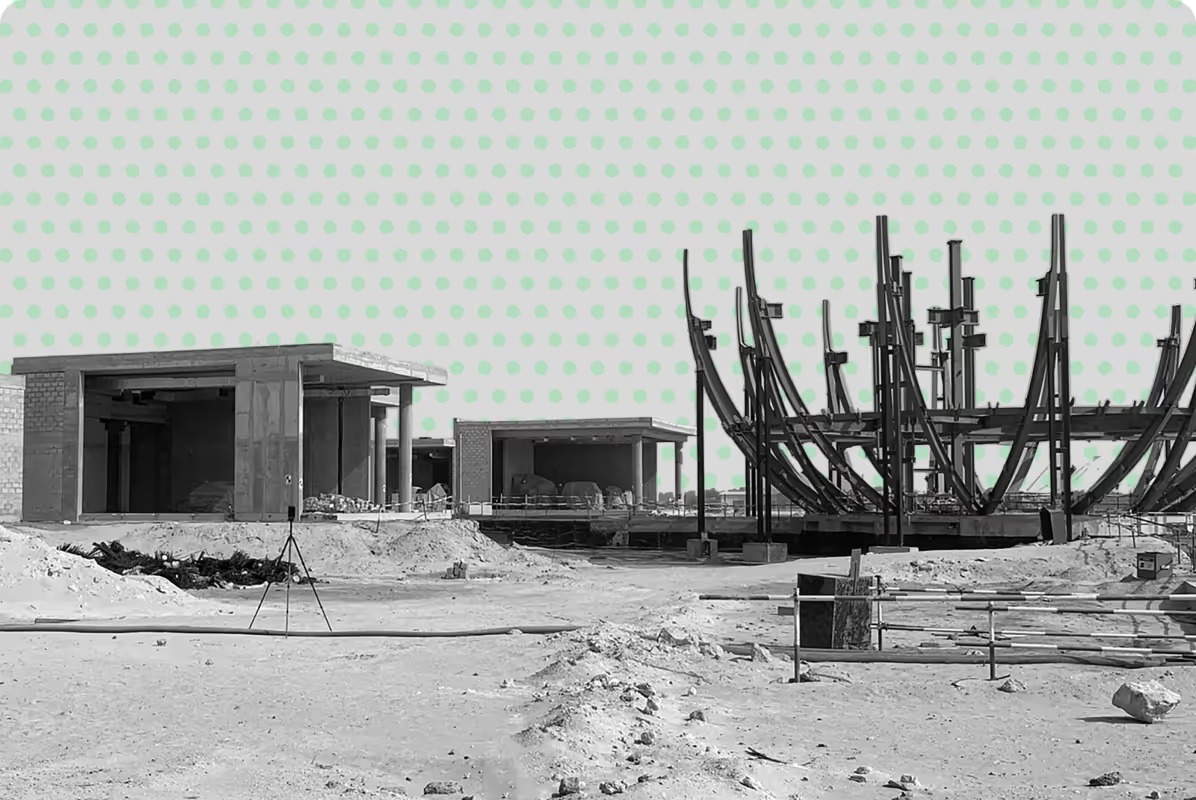
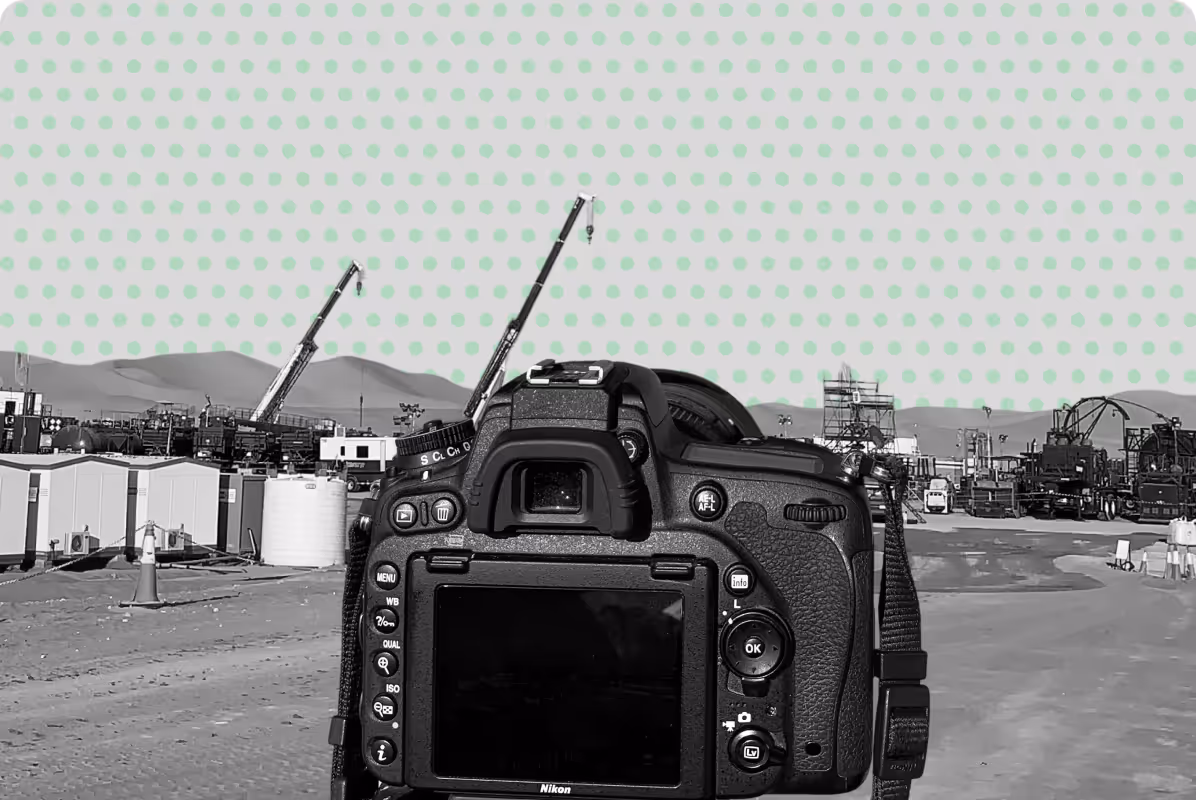
Monitor site progress, measure earthworks, and visualise milestones in real time.
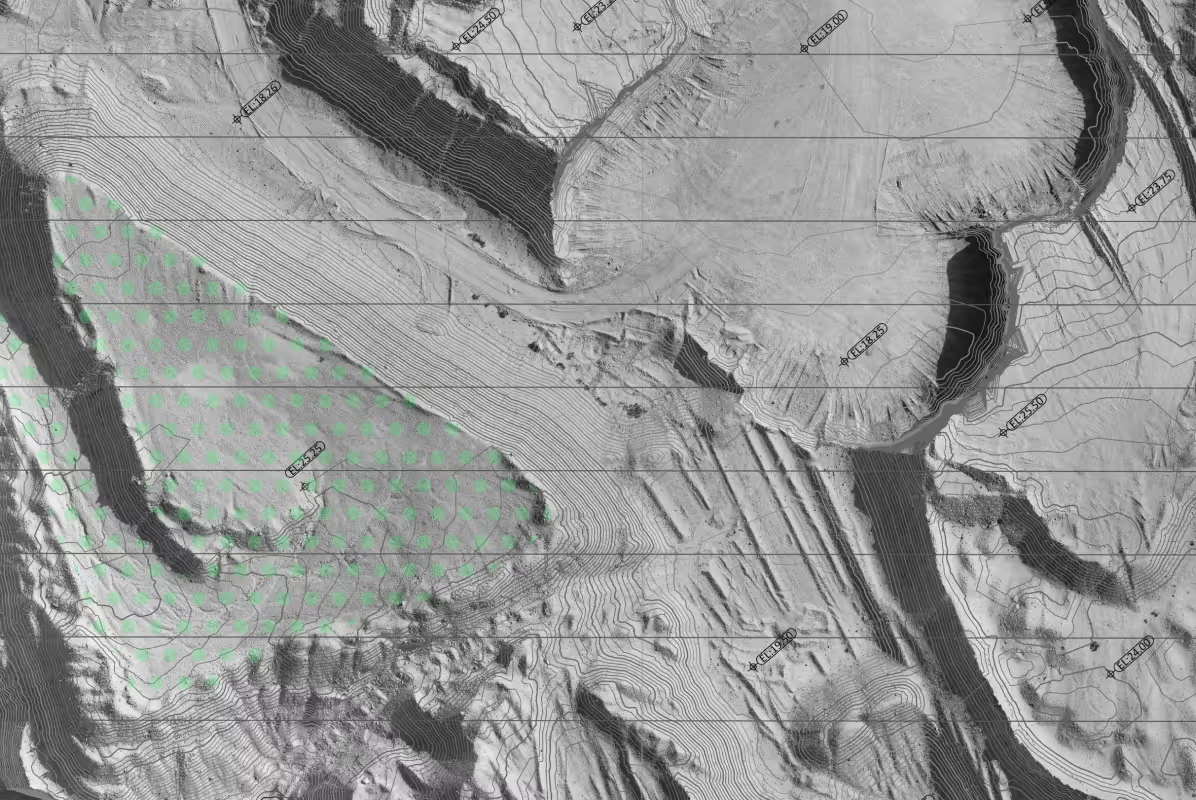
Map erosion, flood risk, and habitat distribution using integrated terrain and hydrological data.
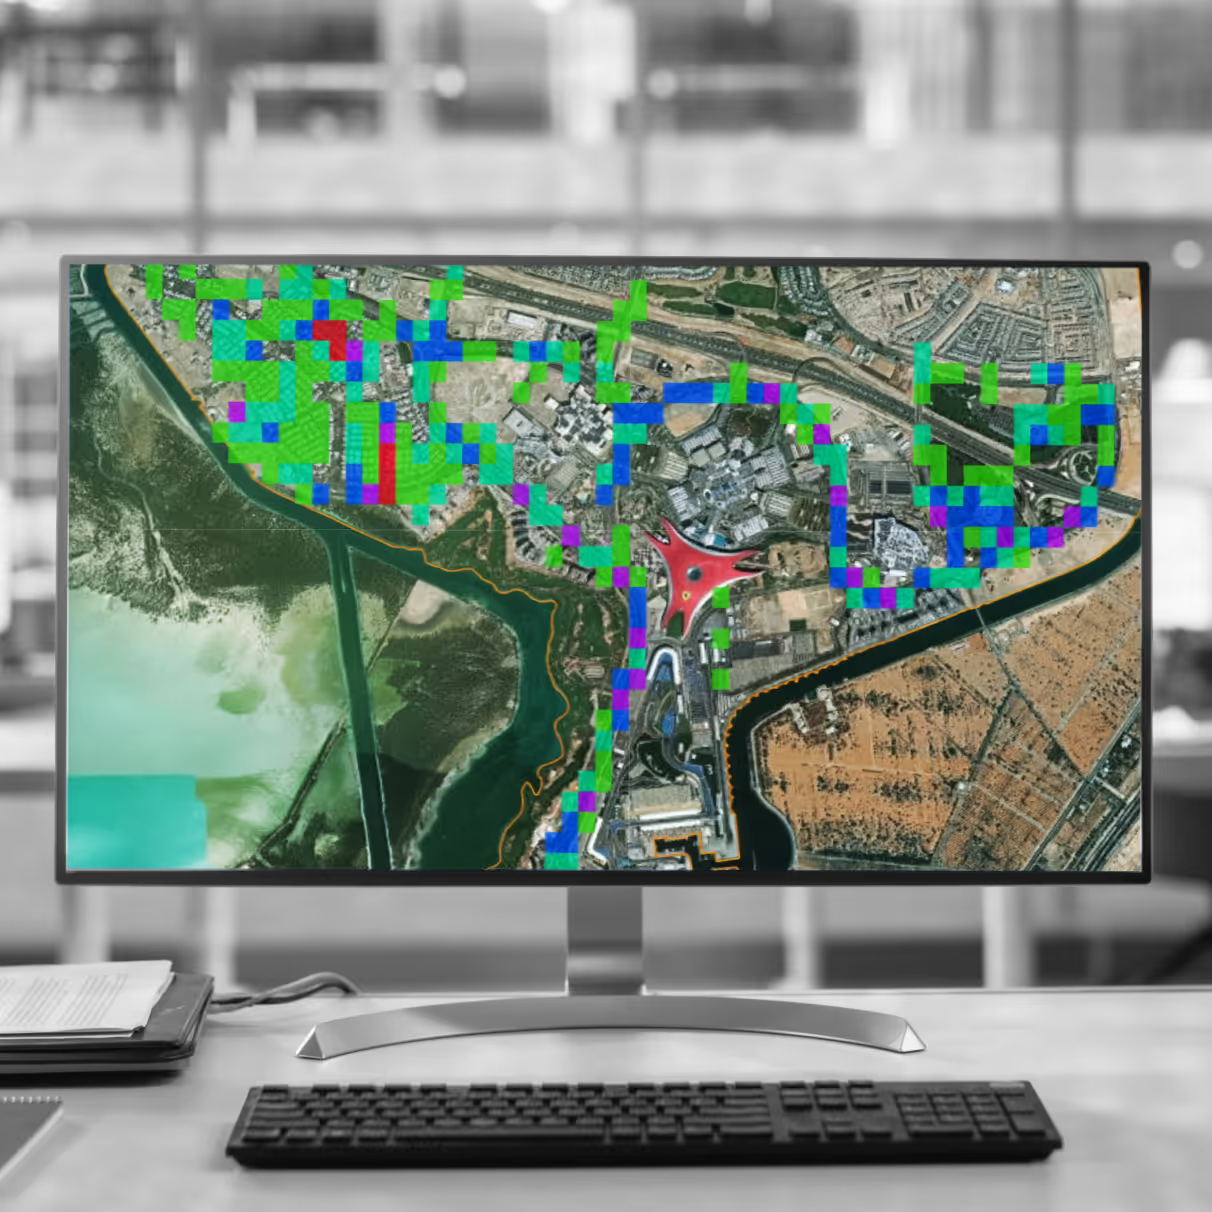
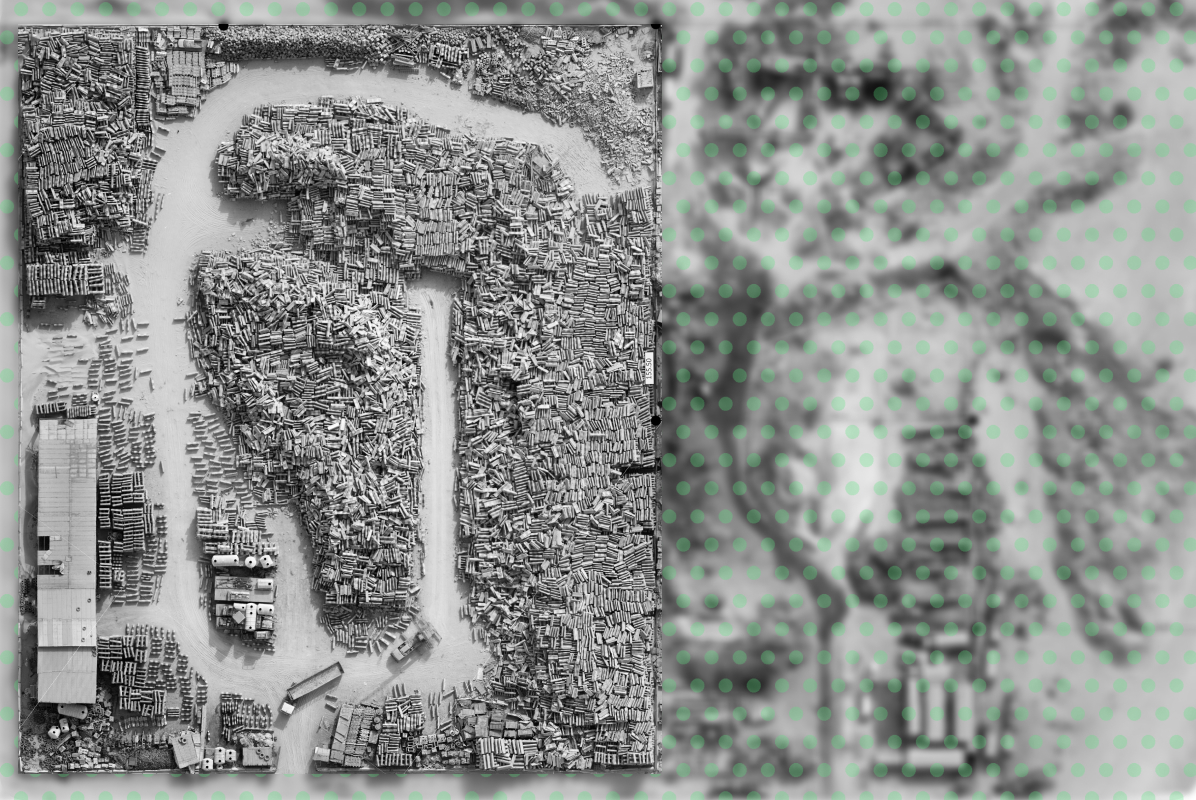
Use NDVI and remote sensing to assess crop health, plan irrigation, and manage resources — able to deploy drone-mounted sensors and apply tailored techniques to suit each terrain.
When is GIS Required
GIS analytics is typically required when projects involve multiple data sources or when spatial analysis is needed to support decisions.
It is commonly used for:
- Early-stage planning and feasibility studies
- Large-scale developments and master planning
- Environmental analysis and monitoring
- Infrastructure and utilities planning
- Construction monitoring and reporting
- Asset management and data organisation
Our Approach to GIS Analytics
At UPG Surveying, GIS is closely integrated with survey data to ensure that outputs reflect actual site conditions and project requirements.
We structure data from multiple sources and prepare it in a way that is clear, consistent, and ready to be used by project teams.
Our process includes:
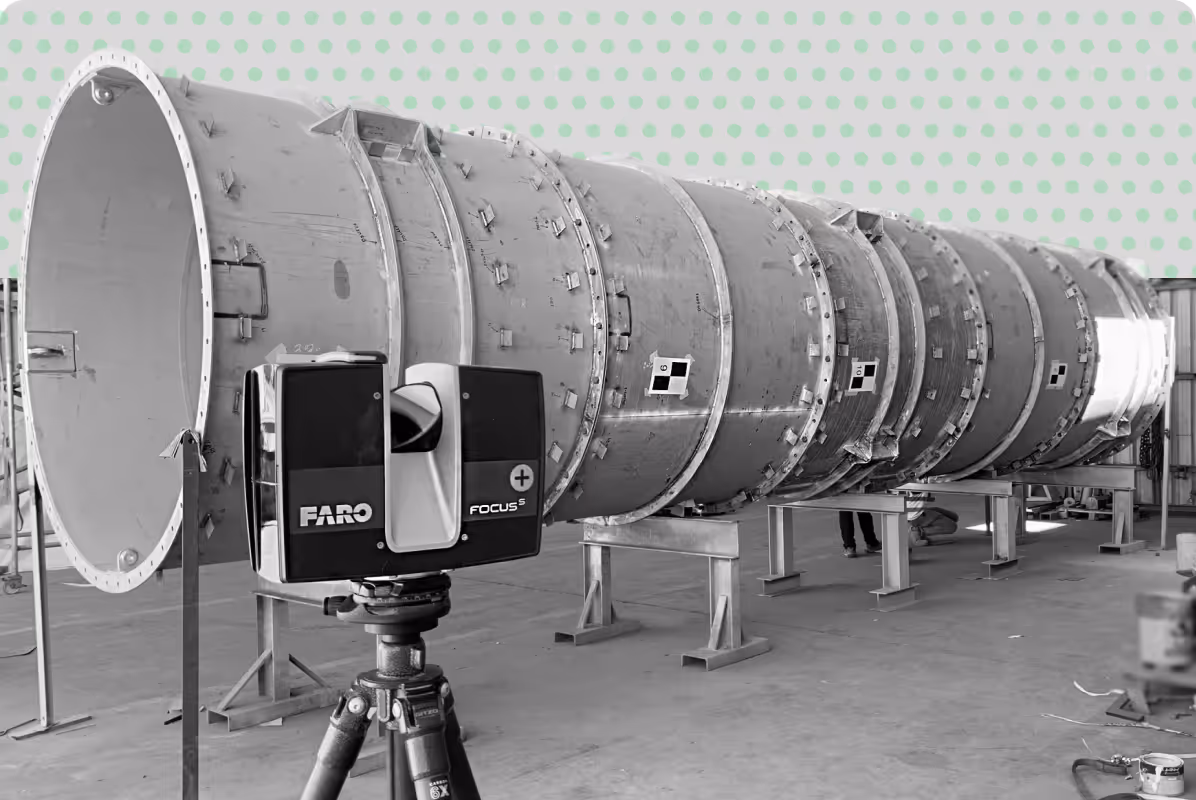
- Collecting and organising spatial data from surveys and other sources
- Structuring and analysing data based on project needs
- Creating maps, dashboards, and visual outputs
- Delivering datasets and reports suitable for planning, design, and monitoring

Why Choose UPG Surveying for GIS Analytics
Integrated survey and GIS expertise
Seamless connection between field data and analysis, ensuring that survey outputs are accurately translated into usable GIS datasets for planning and design.
Clear, decision-focused outputs
Data structured and presented in a way that supports planning, design, and reporting, helping project teams quickly understand site conditions and make informed decisions.
Scalable solutions
Flexible workflows that adapt to project size and complexity, from single-site analysis to large-scale developments and regional studies.
Reliable and structured data delivery
Consistent, well-organised datasets that integrate smoothly with project teams, reducing confusion, rework, and delays.
Deliverables for Your Workflow
UPG takes your scope, level of detail, and required outputs, carries out the fieldwork in line with industry standards, and processes your data — analysing, structuring, and converting it into the deliverables you need:

.png)


Visualise, Analyse, and Manage Spatial Data